Logging with Grafana, Loki, and Promtail is a popular combination for collecting, storing, and visualizing log data in a distributed system. Each component plays a specific role in this setup:
Promtail is a log shipping agent that collects log data from various sources and sends it to Loki for processing and storage.
Functionality: Promtail is responsible for tailing log files, extracting log entries, and adding metadata to them. It can also scrape log entries from systemd journal, Docker container logs, and other log sources.
Configuration: You configure Promtail to specify which log files or sources it should monitor and where to send the collected data (i.e., Loki).
Loki is a horizontally-scalable, multi-tenant log aggregation system. It stores log data in a way that makes it easy to query and retrieve specific log entries efficiently.
Functionality: Loki organizes log entries into streams, which are like log files or topics, based on labels and indexes them for fast querying. It uses a chunk-based storage format for efficient storage and retrieval of logs.
Query Language: Loki provides a query language called LogQL, which is similar to PromQL (Prometheus Query Language) and allows you to filter, aggregate, and visualize log data.
Integration with Grafana: Loki is typically integrated with Grafana for log visualization. Grafana’s Explore feature allows users to query and visualize log data stored in Loki seamlessly.
Grafana is a popular open-source platform for monitoring and observability. It can be used to create dashboards and panels for visualizing various data sources, including logs from Loki.
Functionality: Grafana allows you to create custom dashboards that display log data in a user-friendly manner. You can create visualizations, alerts, and annotations to gain insights into your application’s log data.
Integration with Loki: Grafana integrates with Loki as a data source. You configure Grafana to connect to Loki so that you can build log-based dashboards and queries using Loki data.
The typical flow of log data in this setup is as follows:
-
Promtail collects log data from various sources and sends it to Loki. It enriches the logs with labels and other metadata.
-
Loki stores the log data efficiently, allowing for fast and efficient querying using LogQL.
-
Grafana is configured to connect to Loki as a data source. Users can create custom dashboards, panels, and queries to visualize and analyze log data.
Let’s create a working setup to better understand the logging framework. Assume that you have already installed Docker in your local environment. We will use Grafana, Loki, Promtail, and Nginx Docker images to spin up the containers. We will use the NginX here to visualize logs through Grafana Loki.
Create a folder called “grafana-loki-blog.” Inside the folder, create a YAML file called docker-compose.yaml. Paste the following content into the docker-compose.yaml file:
version: '3.8'

services:

  grafana:
    image: grafana/grafana:10.0.3
    ports:
      - 3005:3000
    volumes:
      - ./config/grafana-datasources.yml:/etc/grafana/provisioning/datasources/datasources.yaml
      - grafana-data:/var/lib/grafana
    environment:
      - GF_DEFAULT_APP_MODE=development
      - GF_LOG_LEVEL=debug
    networks:
      - blog

  loki:
    image: grafana/loki:2.8.4
    ports:
      - 3100:3100
    volumes:
      - loki-data:/loki
      - ./config/loki-config.yml:/etc/loki/local-config.yaml
    command: -config.file=/etc/loki/local-config.yaml
    networks:
      - blog

  promtail:
    image:  grafana/promtail:2.8.4
    container_name: promtail
    volumes:
      - ./config/promtail.yaml:/etc/promtail/docker-config.yaml
      - /var/lib/docker/containers:/var/lib/docker/containers:ro
      - /var/run/docker.sock:/var/run/docker.sock
    command: -config.file=/etc/promtail/docker-config.yaml
    depends_on:
      - loki
    networks:
      - blog

  nginx:
    image: nginx:latest
    container_name: nginx
    ports:
      - 8000:80
    volumes:
      - ./src:/usr/share/nginx/html
    labels:
      logging: "promtail"
      logging_env: "dev"
    networks:
      - blog

volumes:
  loki-data:
  grafana-data:

networks:
  blog:
Let’s break down each part of the configuration:
Grafana Service:
image: Specifies the Grafana Docker image and its version.
ports: Maps port 3005 on the host to port 3000 in the Grafana container, allowing access to the Grafana web interface.
volumes: Mounts configuration files and data volumes to the container. It includes a datasources configuration file and a data volume for Grafana’s data storage.
Create a folder called “config”. Inside there create a yaml file called grafana-datasources.yml. Paste below content.
apiVersion: 1

datasources:
  - name: Loki
    type: loki
    access: proxy
    url: http://loki:3100
    version: 1
    editable: false
    isDefault: true
networks: Connects the service to the “blog” network, enabling communication between services.
Loki Service:
image: Specifies the Loki Docker image and its version.
ports: Maps port 3100 on the host to port 3100 in the Loki container for accessing the Loki API.
volumes: Mounts configuration files and data volumes, including a volume for Loki’s data storage and a local configuration file.
Inside the “config” folder create a yaml file called loki-config.yml. Paste below content.
auth_enabled: false

server:
  http_listen_port: 3100

common:
  path_prefix: /loki
  storage:
    filesystem:
      chunks_directory: /loki/chunks
      rules_directory: /loki/rules
  replication_factor: 1
  ring:
    kvstore:
      store: inmemory

schema_config:
  configs:
    - from: 2020-10-24
      store: boltdb-shipper
      object_store: filesystem
      schema: v11
      index:
        prefix: index_
        period: 24h

storage_config:
  boltdb:
    directory: /loki/index

compactor:
  working_directory: /loki/compactor
  shared_store: filesystem
  retention_enabled: true

chunk_store_config:
  max_look_back_period: 48h

limits_config:
  retention_period: 48h

table_manager:
  retention_deletes_enabled: true
  retention_period: 48h

analytics:
  reporting_enabled: false
command: Specifies the configuration file to use when starting Loki.
networks: Connects the service to the “blog” network.
Find more about loki in here.
Promtail Service:
image: Specifies the Promtail Docker image and its version.
container_name: Sets a custom name for the Promtail container.
volumes: Mounts configuration files and necessary Docker-related volumes. Promtail collects Docker container logs from /var/lib/docker/containers and uses the Docker socket (/var/run/docker.sock) to discover containers.
Inside the “config” folder create a yaml file called promtail.yaml. Paste below content.
server:
  http_listen_port: 9080
  grpc_listen_port: 0

positions:
  filename: /tmp/positions.yaml

clients:
  - url: http://loki:3100/loki/api/v1/push

scrape_configs:
  - job_name: f_scrape
    docker_sd_configs:
      - host: unix:///var/run/docker.sock
        refresh_interval: 5s
        filters:
          - name: label
            values: ["logging=promtail"]
    relabel_configs:
      - source_labels: ['__meta_docker_container_name']
        regex: '/(.*)'
        target_label: 'container_name'
      - source_labels: ['__meta_docker_container_id']
        target_label: 'container_id'
      - source_labels: ['__meta_docker_container_label_logging_env']
        target_label: 'env'
command: Specifies the configuration file to use when starting Promtail.
depends_on: Ensures that the Promtail service starts after the Loki service to ensure Loki is ready to receive logs.
networks: Connects the service to the “blog” network.
You can find more about promtail in here.
Nginx Service:
image: Specifies the Nginx Docker image to use.
container_name: Sets a custom name for the Nginx container.
ports: Maps port 8000 on the host to port 80 in the Nginx container for web access.
volumes: Mounts a directory from the host (./src) into the Nginx container to serve static content.
Create a folder called src. Inside there create a html file called index.html. Add a content in there which you prefer.
labels: Adds custom labels to the container for logging purposes, indicating that Promtail should collect its logs.
In this configuration, we pass logging: promtail as a label to the Nginx container. This label is used to instruct Promtail to scrape and collect the logs specifically from containers labeled with logging: promtail, as we have configured Promtail to pull logs from containers with this label.”
networks: Connects the service to the “blog” network.
Volumes: Defines two named volumes, loki-data and grafana-data, which are used for persistent storage of Loki and Grafana data, respectively.
Networks: Creates a custom Docker network named blog to connect the services within the same network for communication.
Now everything is ready, let’s go to command promote and issue below code.
docker-compose -f docker-compose.yaml up -d
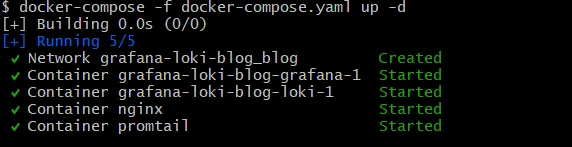
List the containers

Now you can see, all our services we set up are up and running. Open the browser type http://localhost:3005/ . Type user name “admin” and password “admin” in the console. Now you are in the Grafana landing page. Then click the Explore link to view the logs.
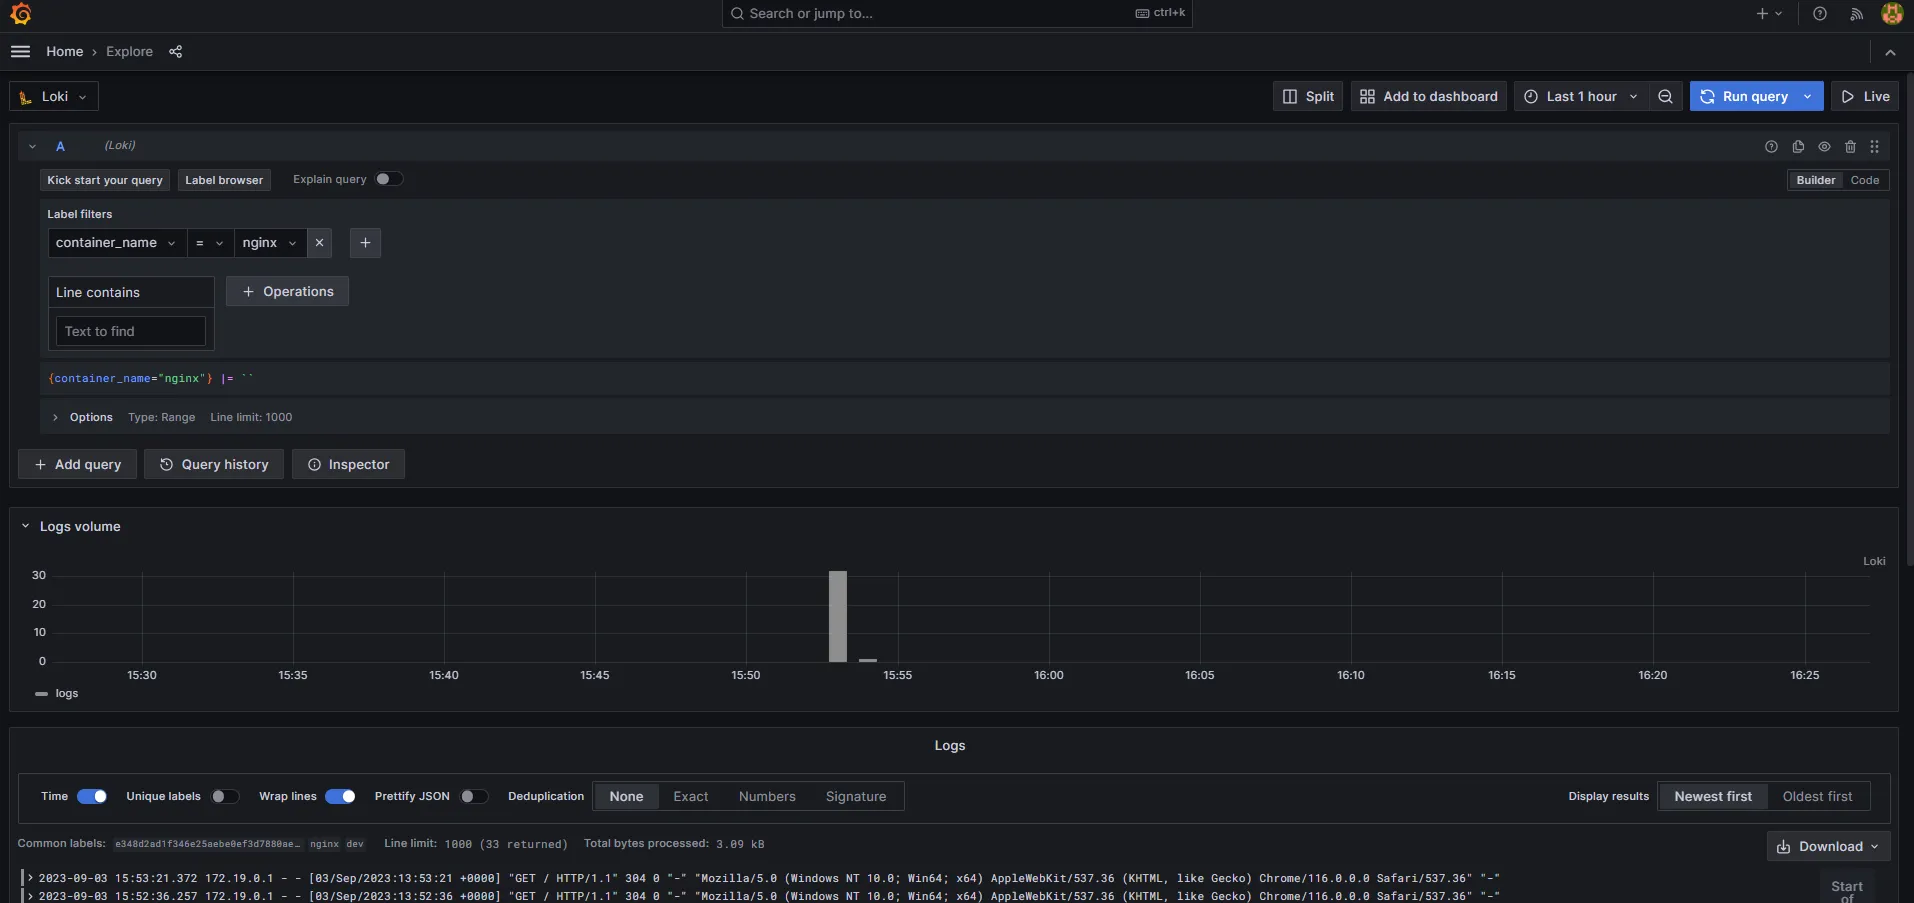
Now you can visualize Nginx log in Grafana.
If you type http://localhost:8000/ in the brower, you can view the index html page. If you want to see the Loki configs type http://localhost:3100/config in the browser.
To shutdown the containers type below command in command line.
docker-compose -f docker-compose.yaml down
Benefits of this logging setup include scalability, efficient storage, powerful querying capabilities, and integration with Grafana for comprehensive observability.
That’s all for now, but this foundational setup can serve as a starting point for expanding your logging and monitoring capabilities to meet more complex requirements. In the upcoming stories, we’ll delve into Loki configuration and Promtail configuration. Until then, happy learning!