Introduction:
In the dynamic world of containerized applications, effective monitoring is the key to ensuring optimal performance and reliability. This blog post dives into the powerful trio of monitoring tools — cAdvisor, Node Exporter, and Prometheus — and explains how to use them to gain valuable insights into container and host metrics. Additionally, we’ll explore a Docker Compose setup that streamlines the deployment of Grafana, Prometheus, cAdvisor, and Node Exporter.
Understanding the Components:
cAdvisor (Container Advisor):
Container Advisor, or cAdvisor, is a lightweight container monitoring tool developed by Google. It provides real-time insights into container resource usage, performance metrics, and other container-specific information. cAdvisor runs as a daemon process on each Docker container and exposes an API that can be utilized by monitoring tools like Prometheus.
Node Exporter:
Node Exporter is a Prometheus exporter designed to collect host-level metrics. It runs on the host machine and exposes a variety of metrics related to CPU usage, memory utilization, disk I/O, and network statistics. Node Exporter plays a crucial role in obtaining a holistic view of the underlying infrastructure supporting your containerized applications.
Prometheus:
Prometheus is an open-source monitoring and alerting system that is highly adaptable to dynamic environments. It follows a pull-based model, collecting metrics from configured targets at regular intervals. Prometheus allows you to define alerting rules, query collected data, and integrate seamlessly with visualization tools like Grafana.
Understanding Docker Compose:
version: '3.8'

services:

  grafana:
    image: grafana/grafana:10.0.3
    ports:
      - 3005:3000
    volumes:
      - ./config/grafana-datasources.yml:/etc/grafana/provisioning/datasources/datasources.yaml
      - grafana-data:/var/lib/grafana

  prometheus:
    image: prom/prometheus:v2.46.0
    ports:
      - 9090:9090
    volumes:
      - ./config/prometheus.yml:/etc/prometheus/prometheus.yml
      - prom-data:/prometheus
    command:
      - '--config.file=/etc/prometheus/prometheus.yml'
      - '--storage.tsdb.path=/prometheus'
      - '--storage.tsdb.retention.time=5d'
      - '--storage.tsdb.retention.size=10GB'
      - '--storage.tsdb.min-block-duration=1h'
      - '--storage.tsdb.max-block-duration=12h'
      - '--web.console.libraries=/etc/prometheus/console_libraries'
      - '--web.console.templates=/etc/prometheus/consoles'
      - '--web.enable-lifecycle'

  cadvisor:
    image: gcr.io/cadvisor/cadvisor:v0.47.2
    privileged: true
    devices:
      - /dev/kmsg:/dev/kmsg
    volumes:
      - /:/rootfs:ro
      - /var/run:/var/run:ro
      - /sys:/sys:ro
      - /var/lib/docker:/var/lib/docker:ro
    expose:
      - 8080

  nodeexporter:
    image: prom/node-exporter:v1.6.1
    expose:
      - 9100:9100

volumes:
  grafana-data:
  prom-data:
Keep below two configuration file in “config” folder.
grafana-datasources.yml
apiVersion: 1

datasources:
  - name: Prometheus
    type: prometheus
    access: proxy
    url: http://prometheus:9090
    version: 1
    editable: true
    basicAuth: false
prometheus.yml
global:
  scrape_interval: 15s
  scrape_timeout: 10s
  evaluation_interval: 15s

scrape_configs:
- job_name: cadvisor
  honor_timestamps: true
  scheme: http
  static_configs:
  - targets:
    - cadvisor:8080
  relabel_configs:
    - source_labels: [__address__]
      regex: '.*'
      target_label: instance
      replacement: 'cadv'

- job_name: nodeexporter
  honor_timestamps: true
  scheme: http
  static_configs:
  - targets:
    - nodeexporter:9100
  relabel_configs:
    - source_labels: [__address__]
      regex: '.*'
      target_label: instance
      replacement: 'node'
The provided Docker Compose file simplifies the deployment of a monitoring stack consisting of Grafana, Prometheus, cAdvisor, and Node Exporter. Let’s break down the key components:
grafana:
Image: Grafana version 10.0.3. Exposes Grafana on port 3005. Mounts a configuration file for Grafana datasources and a volume for Grafana data persistence.
prometheus:
Image: Prometheus version 2.46.0. Exposes Prometheus on port 9090. Mounts a configuration file for Prometheus settings and a volume for data persistence. Defines various command-line options for configuration, storage, and web settings.
cadvisor:
Image: cAdvisor version 0.47.2. Runs in privileged mode and exposes cAdvisor on port 8080. Configures volume mounts for essential paths to gather container metrics.
nodeexporter:
Image: Node Exporter version 1.6.1. Exposes Node Exporter on port 9100.
Volumes:
grafana-data: Persists Grafana configuration and data. prom-data: Persists Prometheus data.
Running the Docker Compose:
To deploy the monitoring stack, navigate to the directory containing the Docker Compose file and execute the following command:
docker-compose up -d
Now, you can then access Grafana on http://localhost:3005 and Prometheus on http://localhost:9090 to start exploring and visualizing your container and host metrics.
Let’s take the next step in enhancing our monitoring setup by importing some pre-configured dashboards into Grafana to visualize metrics effectively.
Importing Dashboards:
Visit the Grafana official website and navigate to the dashboard section.
Use the following links to find predefined templates
Docker and OS Metrics Dashboard
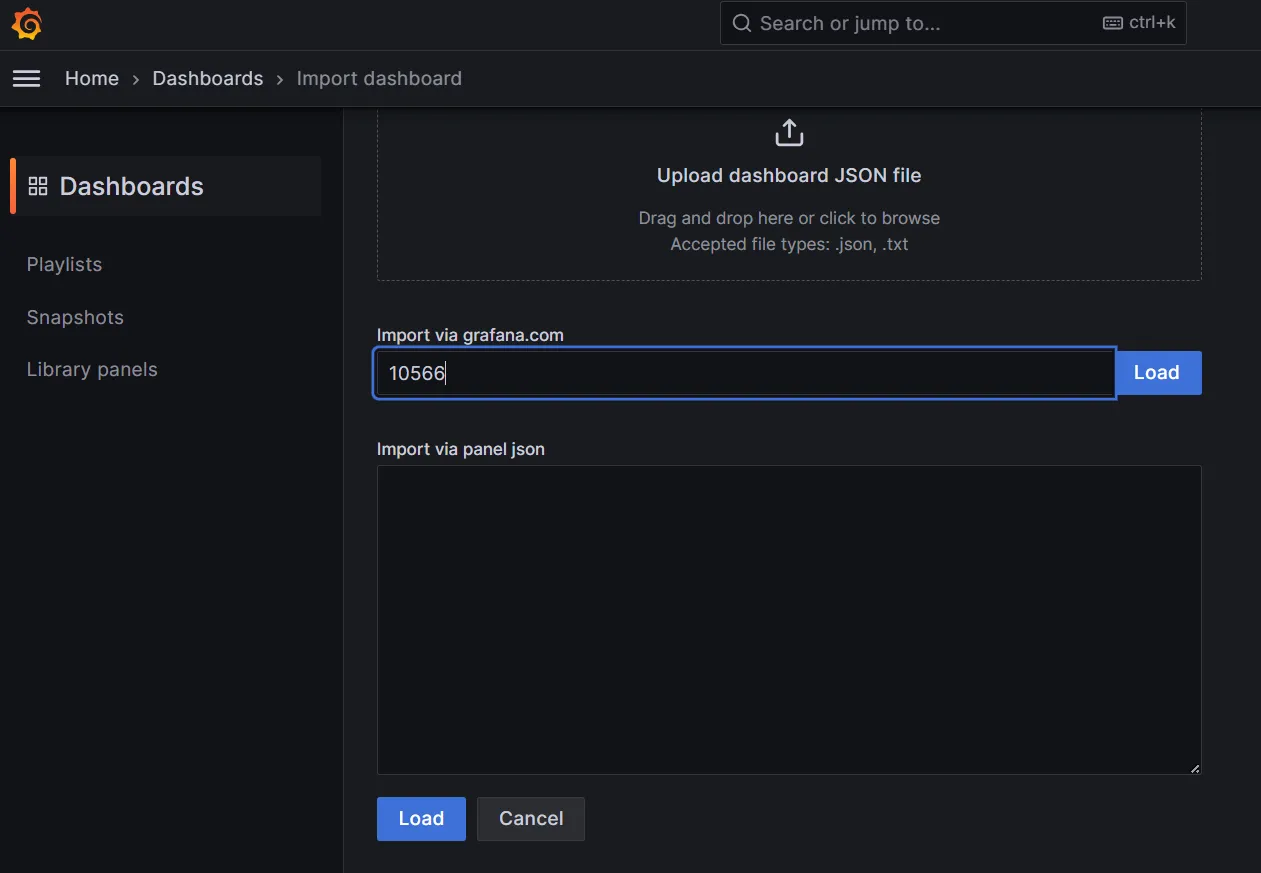
On each dashboard page, find the dashboard ID. In your Grafana dashboard, find “Import.”
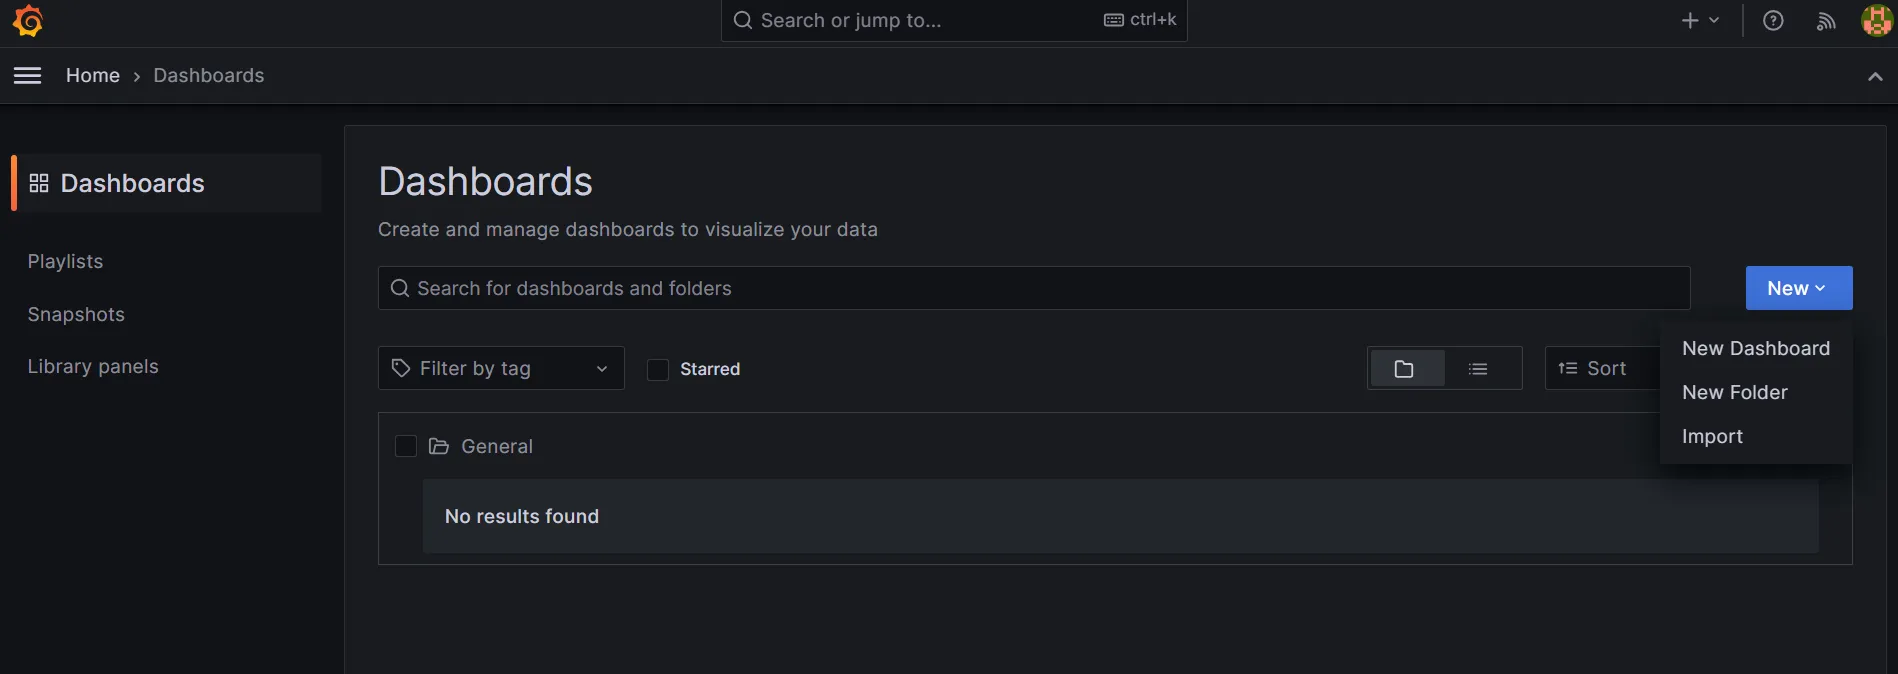
Enter the dashboard ID and follow the prompts to import the dashboard.
Once imported, you’ll see the new dashboards listed on the left sidebar. Click on each dashboard to explore detailed metrics, including container-specific data from cAdvisor and host-level metrics from Node Exporter.
The cAdvisor Exporter Dashboard provides insights into container-specific metrics, helping you understand resource usage, container health, and performance.
The Docker and OS Metrics Dashboard focuses on host-level metrics, giving you a comprehensive view of the underlying infrastructure supporting your containers.
Conclusion:
Now, with these imported dashboards, you can seamlessly visualize and analyze metrics from your containerized environment. The cAdvisor Exporter Dashboard provides detailed container metrics, while the Docker and OS Metrics Dashboard offers insights into the overall health of your hosts. Leveraging Grafana’s flexibility, you can further customize these dashboards or create new ones based on your specific monitoring needs. This integration of Grafana dashboards with cAdvisor, Node Exporter, and Prometheus completes a powerful monitoring stack, enabling you to make informed decisions, troubleshoot issues, and optimize the performance of your containerized applications. Start exploring your metrics and unlocking valuable insights with Grafana today!